Free Factor Analysis
Multifactor statistical analysis tool — eigenvalues, scree plot, loadings, and rotation.
A free, browser-based tool from our library of 54+ free Ed Tools — built for our own classrooms and shared with Singapore trainers and educators.
About Factor Analysis
Multifactor statistical analysis tool — eigenvalues, scree plot, loadings, and rotation.
Key features
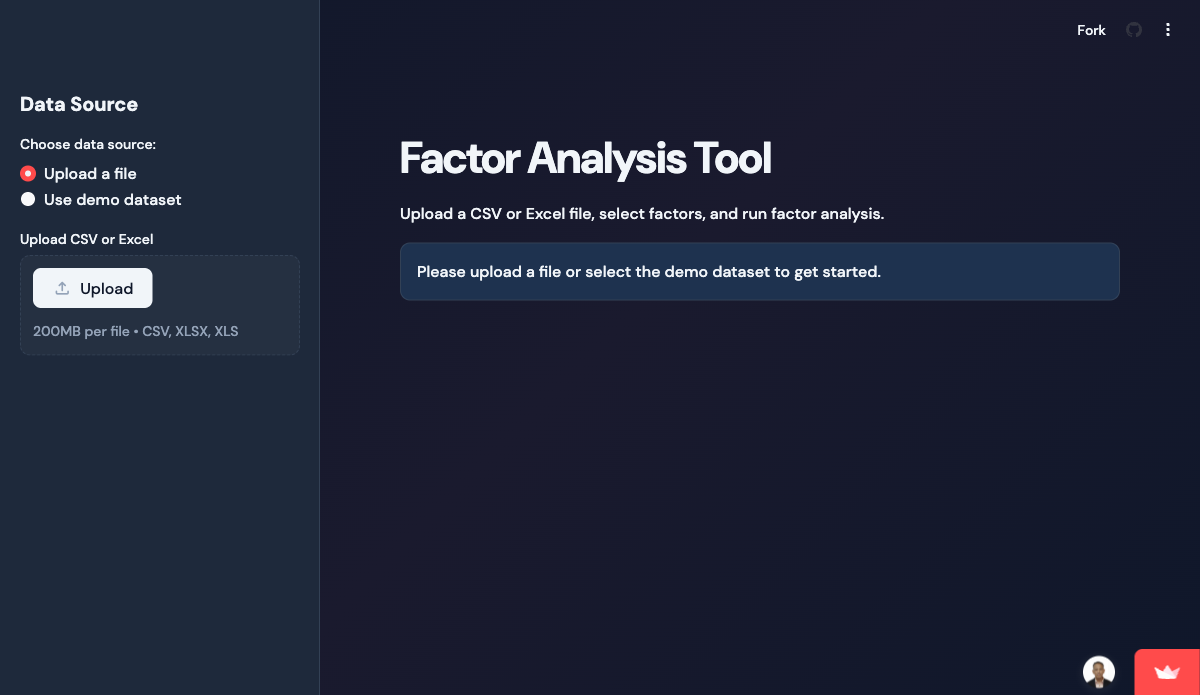
- Upload CSV + select variables
- Bartlett / KMO sphericity tests
- Varimax / oblimin rotation options
Built with
Who uses Factor Analysis?
Singapore training providers, WSQ ATOs, corporate L&D teams, and educational institutes use Factor Analysis inside our AI-LMS-TMS and e-learning deployments. Whether you need a single tool integrated into your existing classroom workflow or the full 54-tool suite, we scope, deploy, and train your organisation end-to-end.
Factor Analysis — frequently asked questions
Is Factor Analysis free to use?
Yes. Factor Analysis is completely free and runs in your browser — there is no signup, licence fee, or trial limit. Tertiary Infotech Academy built it for our own data-analytics sessions and made it openly available to trainers and educators.
Do I need to install anything to use Factor Analysis?
No. Factor Analysis is a browser-based tool — just open the live demo on any modern device. Learners can usually join from a single link with no accounts required.
Can I use Factor Analysis inside my own LMS or training programme?
Yes. We can brand, integrate, and deploy Factor Analysis — or the full suite of 54+ Ed Tools — inside your own Learning / Training Management System with WSQ/TPQA-compliant workflows. Enquire using the form and a consultant will reply within one business day.
Want Factor Analysis branded inside your own LMS?
The tool is free to use as-is. To bundle, brand, or custom-build it into your training platform, tell us what you need — we reply within one business day.
No spam · your details are never shared · trusted by Singapore training providers.
More free tools in Data Analytics
All Free Ed ToolsPivot Visualization
Upload a CSV, build pivot tables in the browser, and chart aggregates — no Excel needed.
Anomaly Detection
Statistical anomaly identifier for operational data — flag outliers and visualise them in one UI.
Mock Data Generator
Generate realistic test datasets — names, addresses, financial figures, time series — straight to CSV.
Bring Factor Analysis and 54+ Ed Tools into your own LMS / TMS
WSQ/TPQA-compliant workflows, SSG API integration, Singapore data residency, and your learner data migrated — scoped at a fixed fee with a typical four-week go-live.